

Data Engineer Resume Examples and Templates for 2026

Add a single line a platform lead cannot infer from your LinkedIn stack list. The differentiator is usually a specific system you owned end to end, not a tool name. Strong openers name a system…
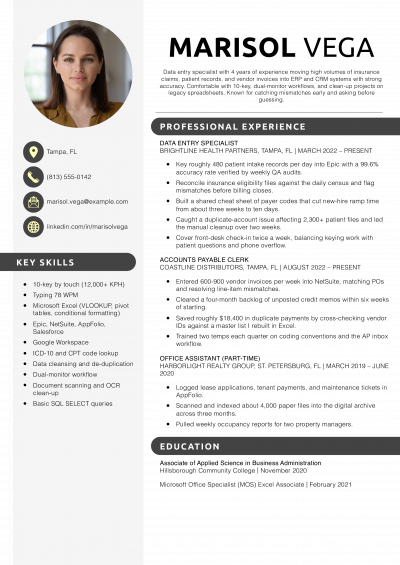
Hiring analytics managers want to see SQL fluency, a named BI tool, and one quantified business outcome on page one, because that tells them within a 30-second scan whether you can ship insight without a babysitter.
The junior data analyst is one to three years in, often from a bootcamp, analytics rotation, or adjacent reporting role. This resume needs to prove you can write SQL, build a dashboard, and explain findings without hand-holding.
The senior data analyst owns end-to-end analyses for a product line or business unit. This resume needs to show stakeholder ownership, experimentation work, and dollar or percentage impact tied to decisions the business actually made.
The lead data analyst sets standards across a team and mentors analysts on craft. This resume needs to prove analytics strategy, data model ownership, and a track record of moving executive decisions with your work.
Hannah Voss
Nashville, TN | (615) 555-0167 | [email protected] | linkedin.com/in/hannahvoss
Data analyst with 6 years across healthcare, B2B SaaS, and consumer subscription businesses. Strong SQL and Python skills, with a habit of pairing every dashboard with a short written interpretation. Have led one analyst hire and mentored three more through their first year.
Senior Data Analyst, Retention
Quillmark Subscription Media | Nashville, TN | 2022-Present
Data Analyst
Holloway Health Systems | Nashville, TN | 2020-2022
Marketing Data Analyst
Branchline SaaS Tools | Knoxville, TN | 2018-2020
Junior Data Analyst
Branchline SaaS Tools | Knoxville, TN | 2017-2018
Lead with the proof that separates you from the other 400 SQL-and-Tableau resumes in the pile. That might be a specific business outcome you owned, a domain like fintech fraud or marketing attribution, or a rare stack like dbt plus Snowflake plus Looker.
Put this in the summary line and again in your top role’s first bullet. Analytics managers and BI directors read the first six lines, then decide. A line like ‘built the retention model that informed the pricing change driving a 14 percent lift in renewals’ beats any skills list.
Strong data analyst bullets pair the analysis with the decision it drove. Name the metric, the magnitude, and the audience. ‘Built funnel dashboard in Looker’ reads as a duty.
‘Built funnel dashboard in Looker that surfaced a 22 percent checkout drop-off, prompting the redesign that recovered $1.1M in quarterly revenue’ reads as ownership. Aim for two or three numbers per role: a dollar figure, a percentage change, and a scope marker like dataset size or stakeholder count. Bullets without a number tend to read as task lists.
Cluster your bullets into three or four analytical categories so a skim reads as a portfolio. Useful groupings include experimentation and A/B testing, product or funnel analytics, forecasting and modeling, and stakeholder reporting or executive dashboards.
Within each cluster, name the tools and the methods. Mention LOD calcs in Tableau, window functions in SQL, cohort retention curves, or a logistic regression you shipped. This signals range without forcing a Analytics manager to guess what you actually did day to day.
Put a technical skills block at the top of page one, under the summary. Split it into Languages (SQL, Python, R), BI Tools (Tableau, Looker, Power BI), Warehouses (Snowflake, BigQuery, Redshift), and Other (dbt, Git, Airflow).
Certifications like Google Data Analytics, Tableau Desktop Specialist, or the Microsoft Power BI Data Analyst sit in a short block below education. Analytics managers and BI directors use this block as a keyword pass and an experience-tier signal before they read bullets.
For entry and mid roles, end with education, then one or two portfolio projects with a link. Name the dataset, the question, the method, and the result.
A line like ‘Predicted NYC bike-share demand from 73M trips using XGBoost in Python, deployed to a Streamlit dashboard’ shows initiative outside paid work. Skip coursework lists after your first job. Senior analysts can drop projects and use that space for a Selected Analyses section instead.
The data analyst resumes that get callbacks share a specific skill mix. The lists below come from our user-built data analyst resumes. Analytics managers and BI directors scan for these patterns first, not generic ‘data-driven decision making’ phrasing.
Hard skills carry the ATS pass. SQL, a named BI tool, and Python or R are table stakes. Soft skills only count when a bullet proves them.
Match the hard-skills list against the target job posting, then use the soft skills as evidence anchors for your accomplishment bullets.
| Soft Skills | % of resumes with this skill |
|---|---|
| Communication | 72% |
| Attention to detail | 69% |
| Problem solving | 43% |
| Critical thinking | 36% |
| Collaboration | 34% |
And here are the top hard skills showing up most often.
| Hard Skills | % of resumes with this skill |
|---|---|
| SQL | 65% |
| Microsoft Excel | 60% |
| Data visualization | 44% |
| Python | 35% |
| Statistical analysis | 26% |
Based on data from thousands of data analysts’ resumes built on ResumeTemplates.com, May 2026.
The items below are what separates a data analyst resume that clears credentialing from one that gets put back in the pile.
Analytics managers and BI directors expect your resume to mirror the language of the specialty they’re hiring for. Pick the row that matches your target role and weave the keywords into bullets, not a wall of skills.
| Niche | Keywords ATS scans for |
|---|---|
| Product analytics | funnel analysis, A/B testing, cohort retention, Amplitude |
| Marketing analytics | attribution modeling, LTV/CAC, campaign measurement, GA4 |
| Financial and operations analytics | forecasting, variance analysis, KPI reporting, executive dashboards |
| Analytics engineering | dbt, Snowflake, data modeling, Airflow |
| Business intelligence | Tableau LOD calcs, Power BI DAX, Looker LookML, semantic layer |
Hiring teams are split between analytics leaders who want AI-assisted speed on SQL and exploration, and leaders who worry about hallucinated joins and unreviewed output. Name the tools you actually use, describe the review workflow, and don’t claim ‘AI-driven analysis’ if your real practice is prompting, editing, and verifying.
Analysts use Copilot or ChatGPT to draft joins and CTEs, then verify against schema and row counts before shipping.
Notebook AI suggests next charts and statistical tests; the analyst still chooses the framing and validates assumptions.
Generative tools draft executive summaries from dashboard data, with the analyst editing for accuracy and business context.
AI generates first-pass model documentation and column descriptions, freeing analyst time for review and lineage work.
A data analyst portfolio earns interviews when each project shows a real question, a real dataset, and a result a stakeholder could act on. Two or three strong projects beat eight Titanic notebooks.
Hosts SQL, Python, and dbt code with README files that frame the business question and result.
Shows interactive BI work without a paid license; link directly from the resume header.
Walks a recruiter through your analysis story, embedded charts, and decision impact.
Publishes reproducible analyses with version-able notebooks recruiters can run.
Structure each project the same way. Open with the business question, name the dataset and size, summarize the method in one line, and close with the result and what a stakeholder would do with it. Recruiters spend under two minutes per project link.
Pin your strongest work. On GitHub, pin three to six repos and write a README for each. A repo without a README reads as abandoned code.
Analytics managers scan the technical skills block for stack overlap before they read bullets. Group your tools by function so the parser and the human both find what they need.
Analytics managers read this list as a map of where your work is heading. The certifications below tell them which track you’ve invested in, whether that’s BI tooling, cloud warehousing, or statistical depth. List the issuing body and the year you completed it.
The top-paying states for data analysts cluster around tech hubs and finance corridors, not the lower-cost remote markets many analysts assume pay competitively. That spread reflects employer concentration: big tech, hedge funds, and consultancies push the ceiling, while regional employers anchor the median. The employment data tells a different story, with the highest analyst headcounts in states that host enterprise data teams across multiple industries.
If you’re geographically flexible, position your resume around the metro that matches your specialty rather than the one closest to home.
| # | State | Avg. Annual |
|---|---|---|
| 1 | Washington | $158,760 |
| 2 | District of Columbia | $137,120 |
| 3 | California | $136,800 |
| 4 | Massachusetts | $132,250 |
| 5 | New Jersey | $130,370 |
| 6 | Virginia | $126,070 |
| 7 | New York | $125,400 |
| 8 | Maryland | $124,340 |
| 9 | Hawaii | $123,880 |
| 10 | Vermont | $120,670 |
| # | State | Workers | Median |
|---|---|---|---|
| 1 | California | 36,850 | $136,800 |
| 2 | Texas | 23,420 | $106,540 |
| 3 | New York | 20,070 | $125,400 |
| 4 | Pennsylvania | 10,430 | $100,320 |
| 5 | North Carolina | 10,140 | $115,380 |
Resume Templates offers HR approved resume templates to help you create a professional resume in minutes. Choose from several template options and even pre-populate a resume from your profile.
One page for analysts with under eight years of experience. Two pages for senior or lead analysts with multiple specialty areas or published work.
Recruiters skim the first half of page one, so put your strongest quantified bullet near the top. Cut coursework, internships from over five years ago, and skill bars.
Anchor the resume on three or four portfolio projects with public links. Each project should name the dataset, the business question, the method, and the result.
Then translate prior work into analytical bullets. A customer service role becomes 'analyzed 6,200 support tickets in SQL to identify the top three churn drivers, presented to product lead.'
Add Google Data Analytics or a Tableau certification to anchor the credentials block. Skip a summary that says 'aspiring data analyst.'
Keep them if they fill an employment gap or if you can rewrite the bullets to show analytical work. A retail role becomes 'built weekly Excel sales report read by three store managers.'
Drop them once you have two analyst roles to show. A senior analyst resume that still lists a barista job from 2017 burns space the recruiter needs for your impact bullets.
Name the tool, describe the workflow, and tie it to time saved or quality gained. 'Used GitHub Copilot to draft SQL boilerplate, cutting query-writing time on routine pulls by 30 percent' reads as honest workflow.
Skip phrases like 'AI-powered analyst' or 'leveraged ChatGPT to drive insights.' Analytics managers read those as bait and assume you don't review the output.
For a data analyst, a tech template is the safest pick, because it keeps your stack, tools, and impact easy to scan. An ATS-friendly template is a solid alternative. Whichever you choose, keep the formatting clean and easy to parse: clear section headings, a standard font, and no graphics a parser can choke on.